IRT is a family of mathematical models that describe how people interact with test items (Embretson & Reise, 2000). These models were originally developed for test items that are scored dichotomously (correct or incorrect) but the concepts and methods of IRT extend to a wide variety of polytomous models for all types of psychological variables that are measured by rating scales of various kinds (Van der Linden & Hambleton, 1997). Additional resources on IRT.
In the context of items scored correct/incorrect, test items are described by their characteristics of difficulty and discrimination, as they are in traditional item and test analysis. But in IRT, these item statistics (referred to as “parameters”) are estimated and interpreted differently than classical proportion correct and item-total correlation. For multiple-choice items, IRT adds a third item parameter referred to as a “pseudo-guessing” parameter that reflects the probability that an examinee with a very low trait level will correctly answer an item solely by guessing.
Although these three item parameters are useful in their own right, for purposes of CAT they are combined into an “item information function” (IIF). The IIF is computed from the item parameters. It describes how well, or precisely, an item measures at each level of the trait that is being measured by a given test (referred to in IRT by the Greek letter theta). A major advantage of IRT is that both items and people are placed on the same scale (usually a standard score scale, with mean = 0.0, and standard deviation = 1.0) so that people can be compared to items and vice-versa.
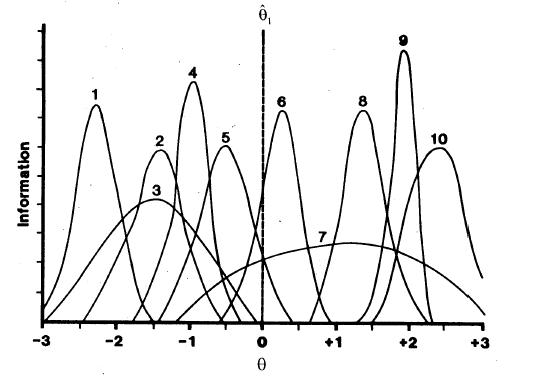
Figure 1 shows IIFs for 10 items. The location of the center of the IIF reflects the difficulty of the item, the height of the IIF reflects the item discrimination, and its asymmetry reflects the magnitude of the pseudo-guessing parameter. Thus, because Item 1 is the easiest item its IIF is on the left end of the theta continuum, and Item 10 is the most difficult. Because Item 9 is the most discriminating it has the highest IIF, and Item 7 is the least discriminating. None of these items has a high pseudo-guessing parameter since all of the IIFs are reasonably symmetric.
Figure 1
Information Functions for 10 Items
IRT Scoring: Maximum Likelihood Estimation
Whereas tests not using IRT are typically scored by number correct, or if using rating scale items by summing a set of arbitrary weights, IRT uses a quite different method of scoring or estimating theta levels for examinees. This method is called “maximum likelihood estimation” (MLE). In contrast to number-correct scoring, MLE weights each item by all three of its item parameters and also considers whether the examinee answered each item correctly. As a result of combining information on the examinee’s entire pattern of responses as well as the characteristics of each item, MLE can provide many more distinctions among examinees than can number-correct scoring. For example, number-correct scoring of a 10-item conventional test can result in at most 11 scores (0 to 10); MLE for the same test can result in 1,024 (2 raised to the 10th power) different theta estimates.
MLE has an additional advantage over number-correct scoring. In addition to providing a for each examinee, MLE also provides an individualized standard error of measurement (SEM) for each. Unlike the SEMs from non-IRT test analysis methods, the SEMs from IRT can vary from person to person, depending on how they answered a particular set of items. Finally, the theta estimates and their SEMs in IRT are not dependent on a particular set of items – they can be determined from any subset of items that an examinee has taken, as long as the parameters for those items have been estimated on the same scale.
References
Embretson, S. E. & Reise, S. P. (2000). Item response theory for psychologists. Mahwah NJ, Lawrence Erlbaum Associates.
Van der Linden, W. J. & Hambleton, R. K. (1997). Handbook of item response theory. New York, Springer-Verlag.