Figure 1 shows the response record of a single examinee’s progress through a CAT. This CAT was designed to make a dichotomous classification around theta = 1.0 (1 standard deviation above the mean), with a plus or minus 1 SEM band (a 68% confidence interval).
Figure 1
A Sample CAT Report
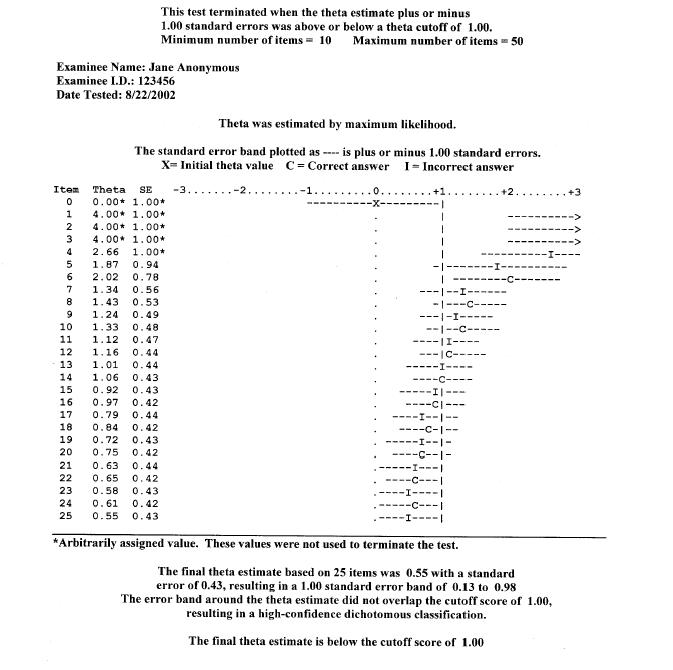
The initial theta estimate (X) was 0.0 and the test item providing maximum information at that theta level was administered and answered correctly (C). The initial step size was 3.0 to attempt to force a mixed (correct/incorrect) response pattern as quickly as possible, so the next item had maximum information at theta = 3.0. It, too, was answered correctly so additional difficult questions were given (Items 3 and 4) until an incorrect answer (I) was obtained. At that point, maximum likelihood estimation was used to obtain a theta estimate of 2.66. The item at that level (Item 5) was also answered incorrectly and the resulting theta estimate was 1.87 with an SEM of .94.
In this test, the examinee’s theta estimate followed a downward trend, falling below the cut score of theta = 1.0 at Item 15. But the theta estimate could not be assumed to be reliably below that cut score because the SEM band still included theta = 1.0. So the test continued for another 10 items until the examinee’s theta estimate and its SEM were entirely below the cut score. This occurred at Item 20 (.55 + .43 = .98, which is just below 1.00) and the test was terminated. The test results indicate that this examinee’s theta estimate was below the cut score, with at least 68% confidence (actually, in this case because that confidence interval was symmetric and 50% was below the mean, the confidence level of a unidirectional decision would be 50% + 34% = 84%). Higher confidence could have been obtained by using a 2 SEM interval around the theta estimate, which obviously would have a required a longer test.
This sample CAT response record illustrates several principles of IRT-based CAT:
- Each time a correct answer was obtained, the theta estimate increased, and an incorrect answer led to a decrease in estimated theta.
- The differences between successive theta estimates decreased as the test proceeded, indicating that the test was converging on the examinee’s theta level.
- The SEM tended to decrease, since additional item responses generally improve the estimation of theta.
- As the test progressed, the examinee tended to alternate between correct and incorrect answers, as can be seen beginning with Item 7 or 8. This is the result of the convergence process that underlies CAT. The result, typically, is that each examinee will answer a set of questions on which he/she obtains 50% correct, even though each examinee will likely receive a set of questions of differing difficulty. In a sense, this characteristic of a CAT tends to equalize the “psychological environment” of the test across examinees of different trait levels. By contrast, in a conventional test the examinee who is high on the trait will answer most items correctly and the low trait examinee will answer most of the items incorrectly.
Although this example is a CAT designed for dichotomous classification, the same principles would be observed in an equiprecise CAT. The only difference would be in the termination criterion. Rather than ending the CAT when estimated theta was reliably below the cut score, an equiprecise CAT would end when the SEM associated with the theta estimate fell below a prespecified value (e.g., .20).